A complete cryptocurrency toolkit designed for precision. Global market analysis (News, Options, ETF, On-Chain) updated multiple times daily. Professional volume footprint charts, liquidation and limit order heatmaps, plus proprietary indicators for over 500 trading pairs.
Stop guessing. Start analyzing with precision tools built for crypto market.
We filter the noise by synthesizing data from over 10+ premium crypto media outlets and expert sources.
Follow the 'big money' in the options market to find hidden support and resistance.
We track the actual movement of capital on the blockchain to confirm or invalidate price trends.
Track institutional fund flows to understand market demand.
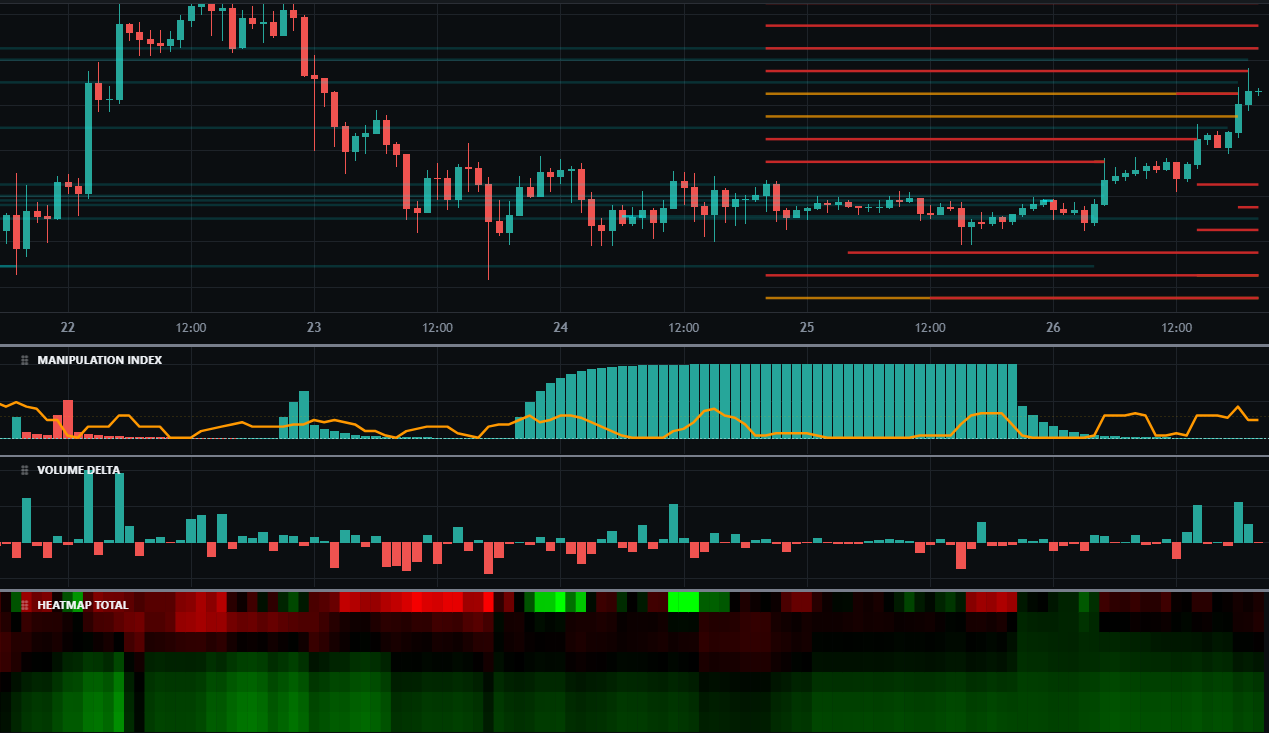
Go beyond traditional candlesticks. See exact buying and selling pressure inside every price level to spot accumulation and exhaustion.
Identify where highly leveraged traders are positioned. Anticipate market-maker hunts and find high-probability reversal zones.
Monitor changes in sell or buy pressure across the entire market depth (from 1% to 60% of the price) in real time.
Manipulation Index, Orderbook coin heatmap, Orderbook Total market heatmap, AVG Total, AVG Coin
Discover how to combine our unique tools and data to find trade opportunities.
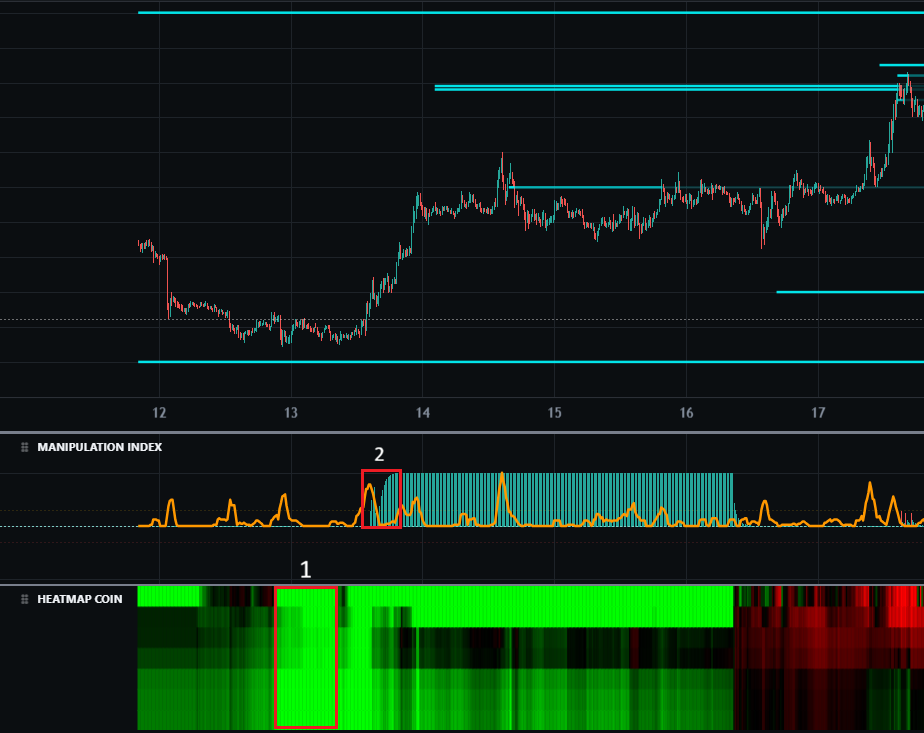
On April 12, the Heatmap Coin Indicator signaled extreme buyer pressure. A massive concentration of buy-side liquidity was detected from 1% to 60% below market price, creating a structural floor that absorbed all sell-side momentum.
Following the liquidity buildup, the Manipulation Index flagged a high-intensity buyer-driven anomaly. Our algorithm detected aggressive order book layering and volume spikes designed to trigger an upward expansion.
The confluence of deep limit-order support and active manipulation led to a decisive breakout, propelling the price +10% within the following session.
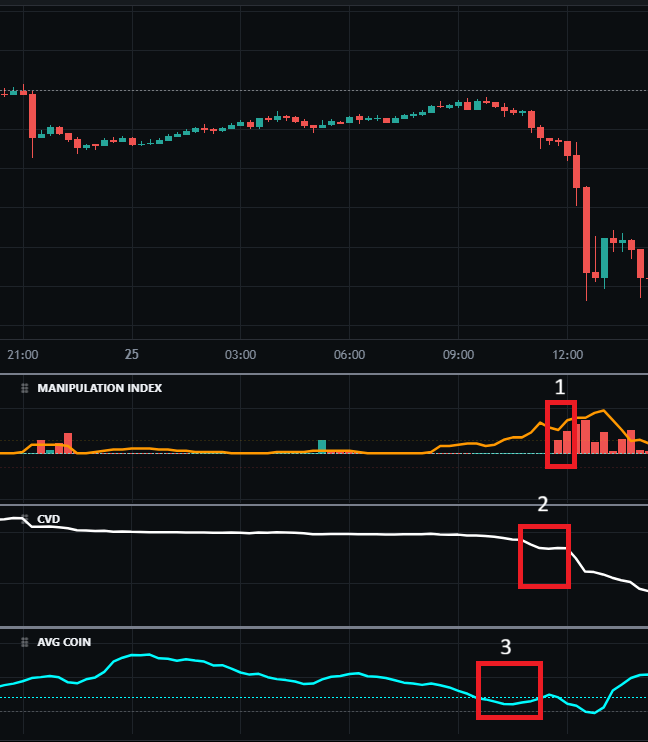
On April 25, the Manipulation Index flagged intense sell-side activity on the TRUMP token. The proprietary algorithm identified aggressive order book spoofing and layering by large-scale sellers, signaling an impending trend reversal.
Simultaneously, the CVD (Cumulative Volume Delta) showed a sharp decline, confirming heavy "Market Sell" orders. While the price was still holding, the CVD divergence revealed that buyers were being overwhelmed by active aggressive selling.
The AVG Coin Indicator—which tracks the global distribution of limit orders—dropped to its lowest value in several days. This indicated a massive withdrawal of buy-side liquidity (bids) and a surge in sell-side overhead (asks), leaving the asset vulnerable to a rapid decline.
As sell-side manipulation intensified and bid support vanished, the price collapsed, resulting in a -13% move.
All features are currently free during the beta testing phase.
123 Crypto Avenue, Tech District, Dubai, UAE