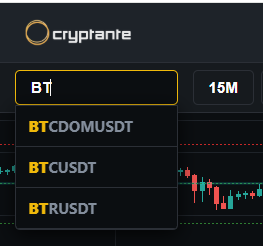
Asset Selector & Timeframe Switcher
Allows users to seamlessly search for trading pairs and select their preferred chart timeframes (e.g., 15M) for real-time market analysis.
Welcome to Cryptante, our professional analytics platform. Analyze the market, trade with confidence, and grow your investments—all on one platform. Discover all the tools available on our platform. Below, you’ll find practical examples of how to use them independently or combine them to elevate your strategy.
Cryptante delivers pure, real-time crypto market intelligence: news analysis, options markets, ETFs, On-chain, and Netflow. Our indicators go beyond outdated technical analysis, leveraging live exchange data: order book, volume, liquidations, funding rates, cluster charts, whale market orders, and a unique manipulation indicator. Together, they grant ultimate visibility into the current market status of over 500 crypto assets.
This page features our Global Market Analysis, covering CEX, DEX, News, Crypto Options, ETFs, and On-chain data. The analysis updates automatically four times a day, driven by the latest data from each sector. Additionally, you can navigate to crypto asset charts from this page by clicking the Charts button.
Tracks real-time aggregate capital inflows and outflows across major centralized exchanges. By monitoring spot and derivative transactions across 5m, 15m, 1h, 4h, and 24h timeframes, it helps identify immediate or long-term institutional buying and selling pressure.
Provides a comprehensive overview of decentralized market sentiment in real time. It captures the global Long/Short balance, screens for assets with extreme bullish or bearish sentiment, and analyzes individual core tokens
Generates systematic daily and weekly market intelligence. It synthesizes macroeconomic catalysts, institutional ETF flows, and options data to deliver clear outlook verdicts (Bullish/Neutral/Bearish), outline key support/resistance magnets, and map out tail risks for strategic planning.
Delivers data-driven narrative intelligence by tracking major media catalysts. It breaks down current news trends, isolates critical industry events, and highlights immediate regulatory or systemic risks to keep traders ahead of sentiment-driven market swings.
Analyzes derivative order flow and market maker positioning from the options market. It identifies critical price magnets based on Max Pain levels, maps out key support/resistance walls fortified by open interest, and evaluates implied volatility to flag potential gamma squeezes.
Delivers real-time institutional intelligence by tracking global ETF metrics. It analyzes net volumes, detects shifts in institutional dominance, and evaluates the premium/discount variance (ETF vs BTC) to uncover hidden spot accumulation or distribution phases.
Delivers real-time ledger intelligence by tracking raw blockchain transactions. It monitors network health, flags the absence or presence of major whale movements, and analyzes capital reallocation trends (such as shifts toward RWAs) to assess long-term spot market stability.
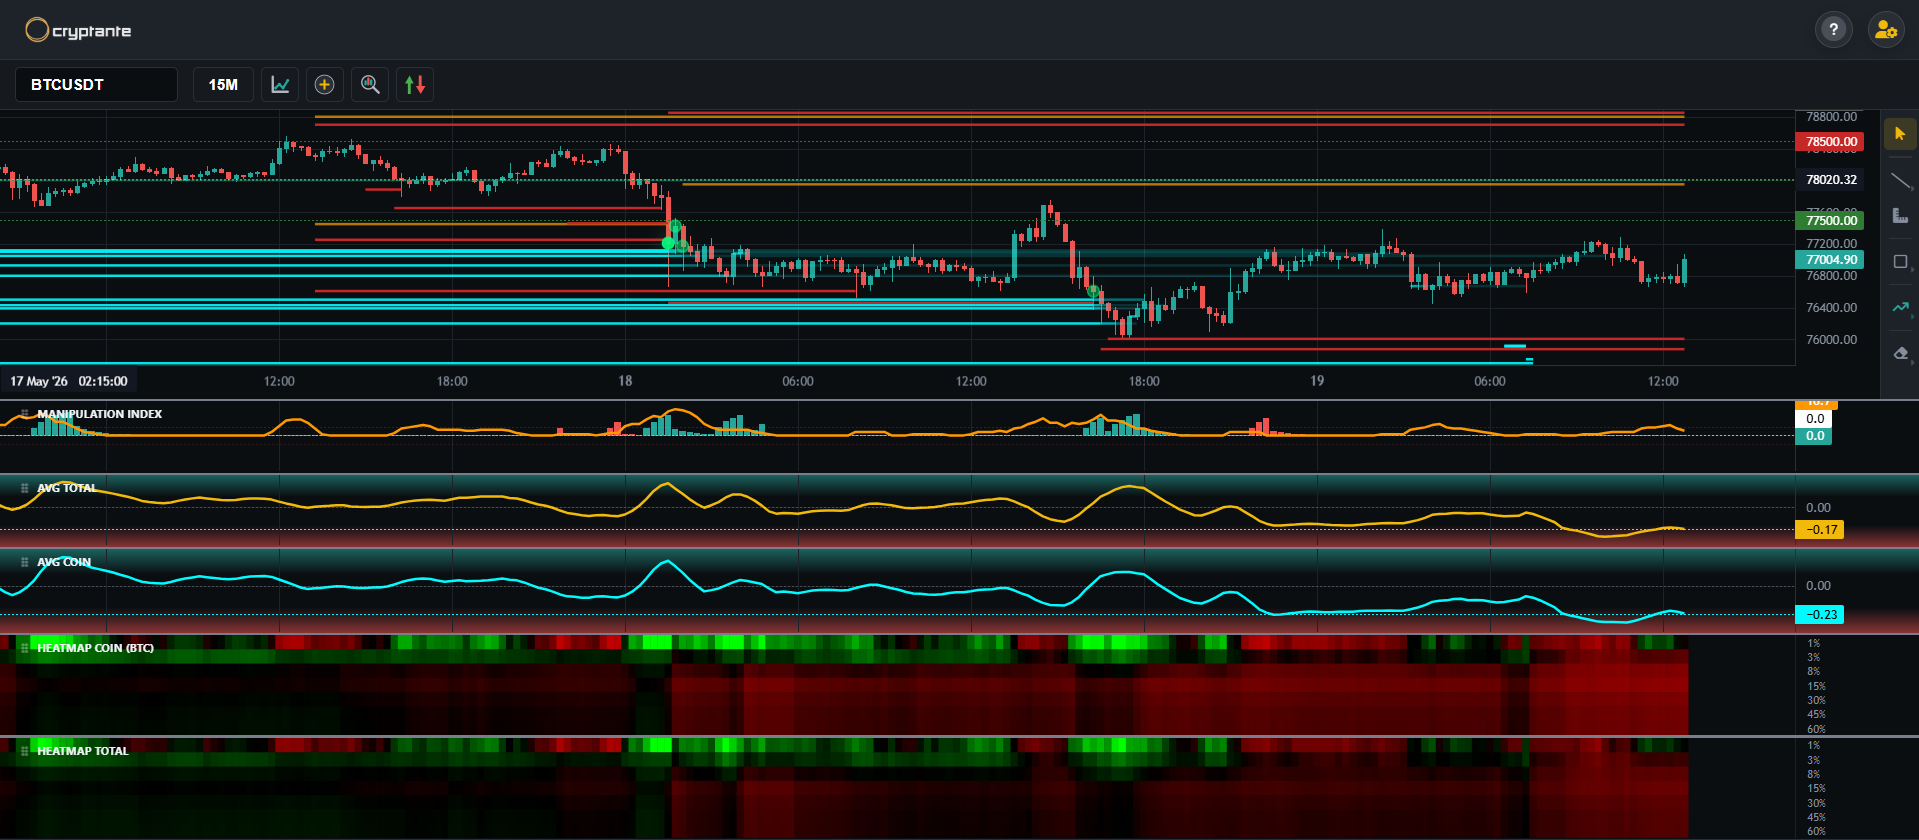
Designed for scalpers and day traders, the advanced charting suite provides unprecedented granularity into institutional order books and real-time execution flows.
Allows users to seamlessly search for trading pairs and select their preferred chart timeframes (e.g., 15M) for real-time market analysis.
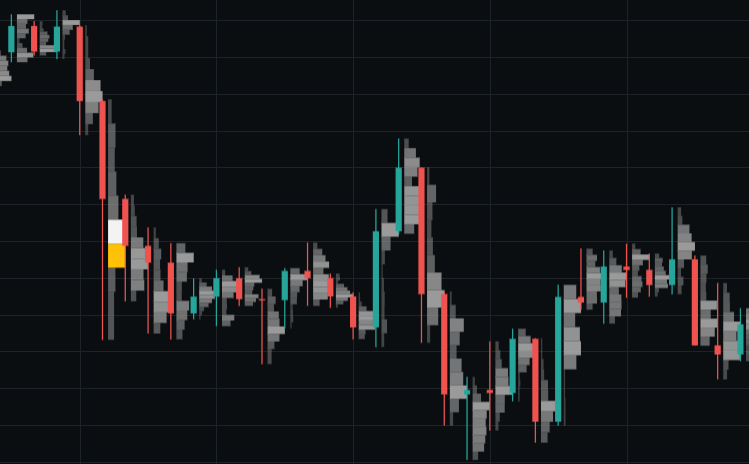
Visualizes intra-candle volume distribution in real time. The indicator highlights volume density using a dynamic shading scale, where lighter clusters represent higher trading activity. Maximum volume nodes within the selected chart range are distinctively flagged in white and yellow. For optimal precision, cluster analysis becomes significantly more informative on higher timeframes and is disabled on the 1-minute interval.
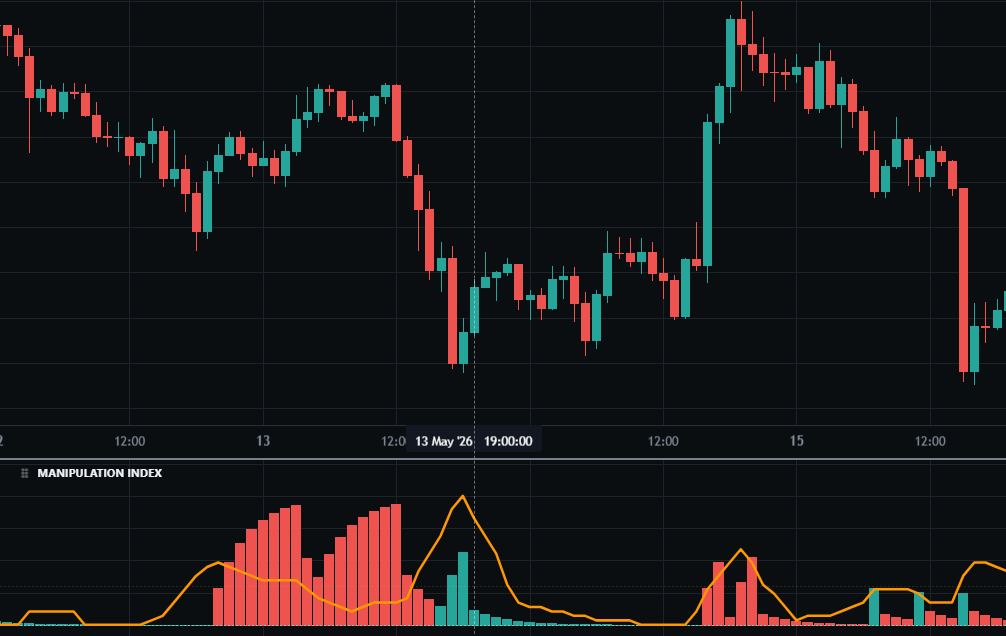
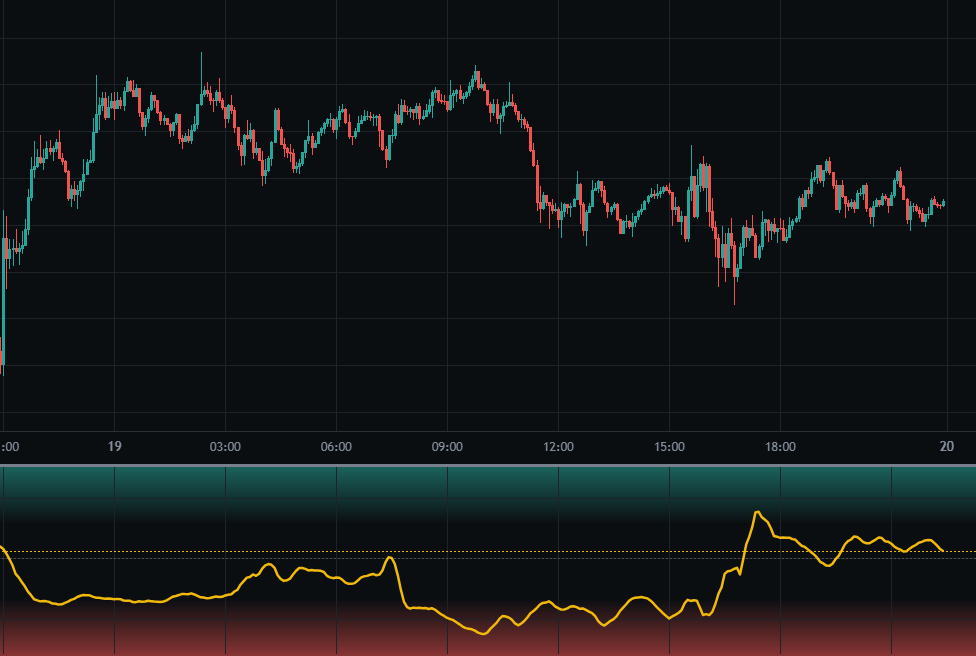
A proprietary oscillator designed to detect hidden institutional market anomalies. It utilizes green bars to measure aggressive buying pressure and red bars to measure selling pressure, overlaid with a dynamic yellow line that quantifies the absolute strength of market manipulation. By tracking these imbalances, it helps traders gauge order flow dominance and anticipate upcoming price reversals or continuations.
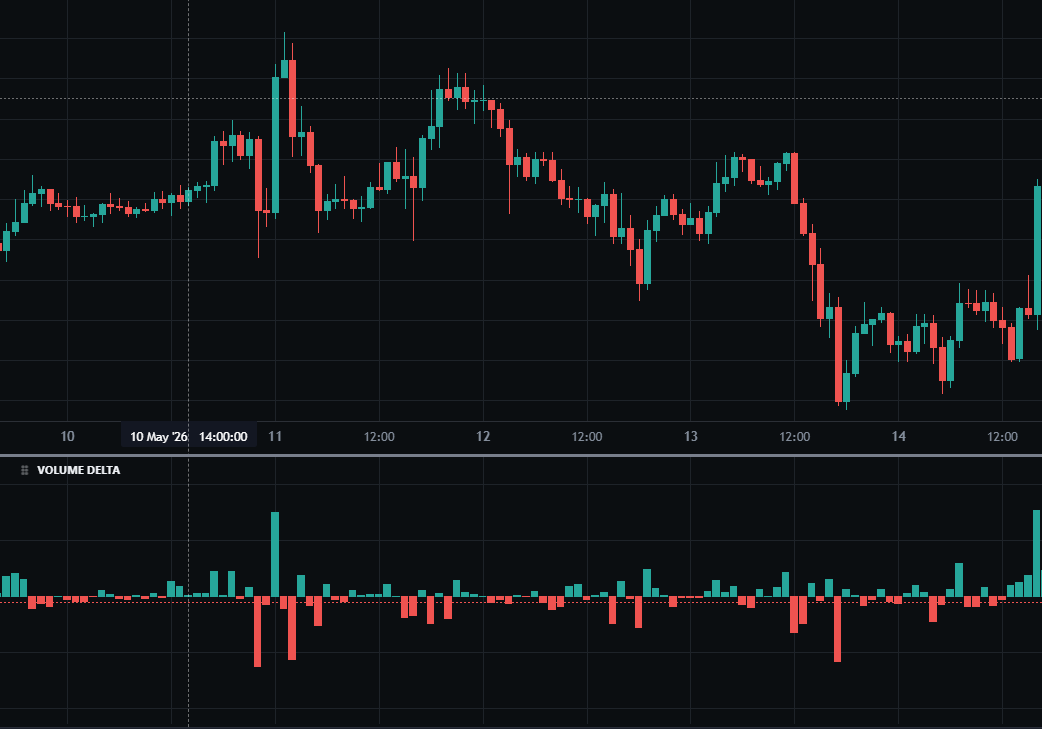
Measures the net difference between buying and selling volume within each timeframe interval. It represents this buying and selling pressure through dynamic green (positive delta) and red (negative delta) histograms, allowing traders to quickly identify shifts in aggressive market participation and detect potential absorption phases near key levels.
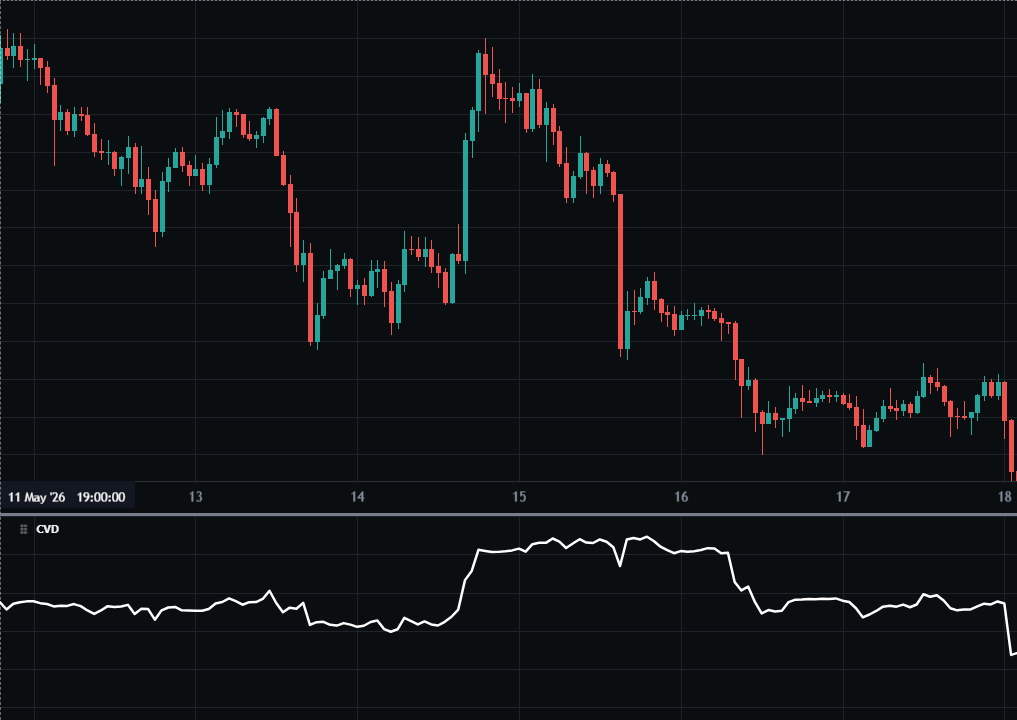
Cumulative Volume Delta (CVD) tracks the cumulative sum of volume delta over time. By visualizing the ongoing buildup of buying or selling pressure, it helps traders identify long-term divergence between price action and net transaction flows, revealing institutional absorption or exhaustion that typically precedes major trend reversals.
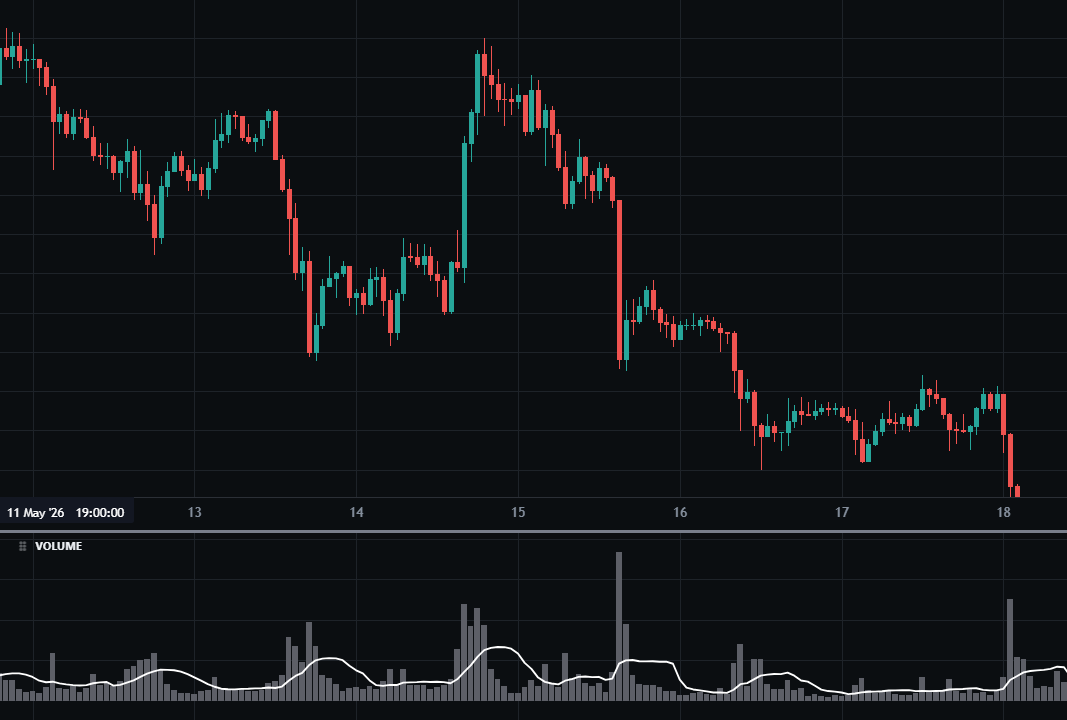
Displays the total buying and selling volume executed within each specific candle interval. It serves as a vital tool for confirming price breakouts, assessing current liquidity, and identifying major institutional participations where massive volume spikes signal the entry of large-scale market participants.
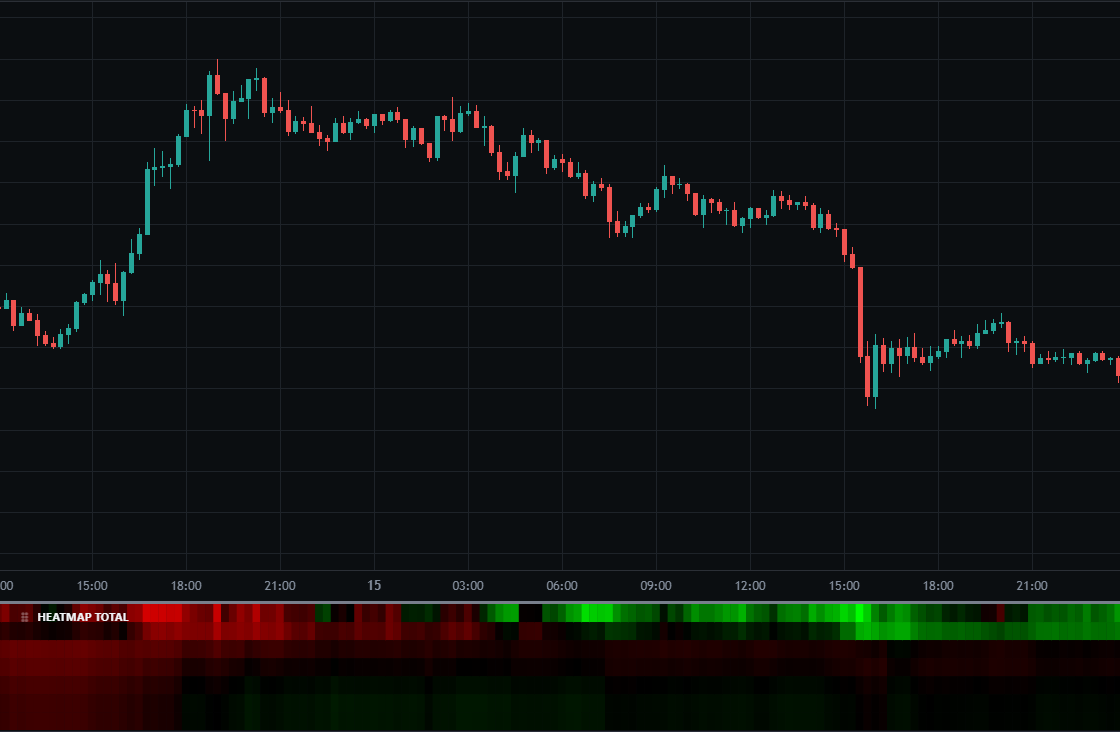
Visualizes the real-time order book imbalance between limit buy and sell orders for the selected asset. It maps the net difference across deep liquidity pools ranging from 1% to 60% distance from the current spot price. Green shades represent a dominance of buy limits (bids), while red shades indicate a heavy concentration of sell limits (asks). The brightness of the color directly corresponds to the strength of the limit order pressure.

Visualizes the real-time order book imbalance between limit buy and sell orders across the entire market (all tracked assets combined). It maps the cumulative net difference across deep liquidity pools ranging from 1% to 60% distance from the current spot prices. Green shades represent a market-wide dominance of buy limits (bids), while red shades indicate a heavy market-wide concentration of sell limits (asks). The brightness of the color directly corresponds to the absolute strength of the aggregate market-wide limit order pressure.
A sophisticated order book imbalance oscillator designed for the selected trading pair. It measures the real-time ratio between Bids (buy limits) and Asks (sell limits) across 9 distinct layers of depth (ranging from 1% to 60% distance from the spot price). A positive value (green) signifies a high concentration of buying support, while a negative value (red) indicates strong overhead sell pressure for the specific asset.
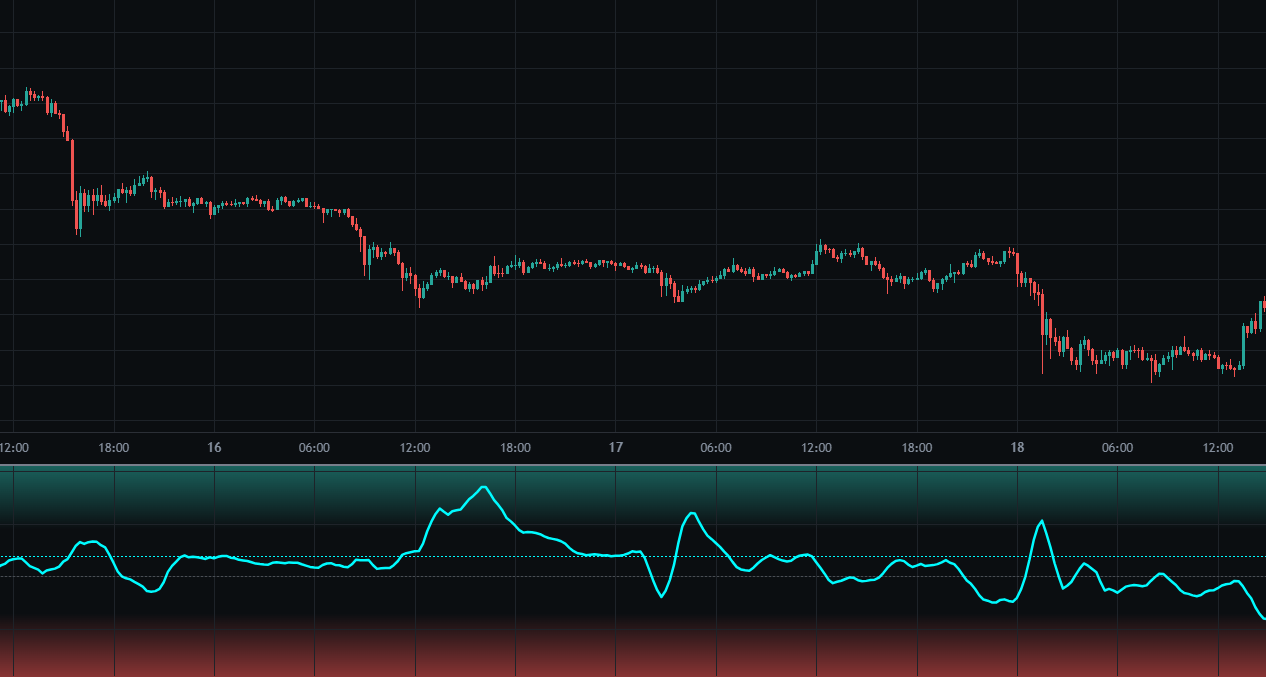
A sophisticated aggregate order book imbalance oscillator that measures the total volume ratio between Bids (buy limits) and Asks (sell limits) across the entire market (all tracked assets combined). It analyzes liquidity depth layers from 1% to 60% distance from current spot prices in real time. This market-wide index provides a high-level view of global capital flows, where green spikes signal broad institutional accumulation and red spikes highlight strong aggregate distribution phases.
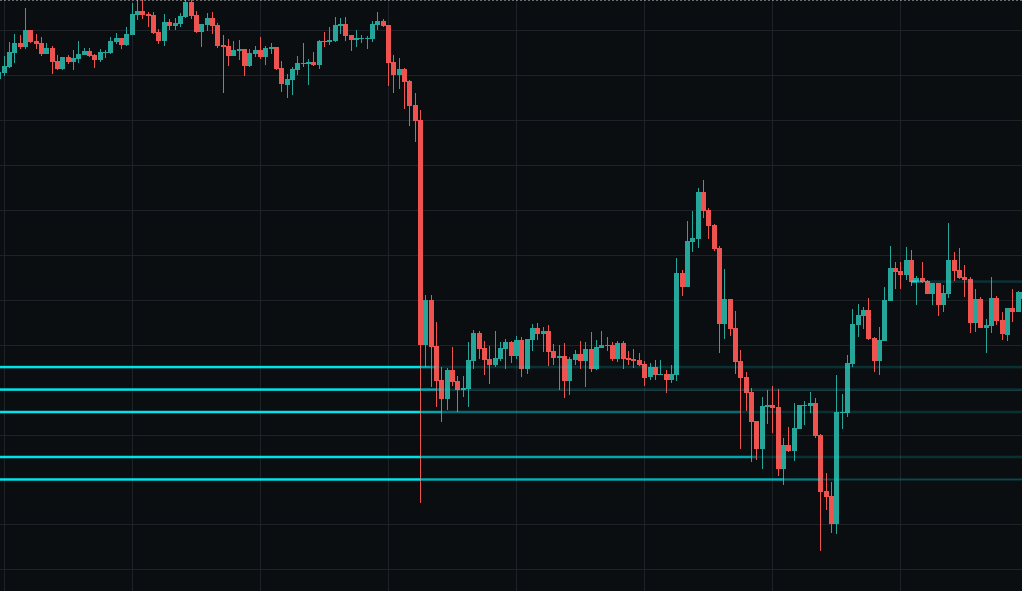
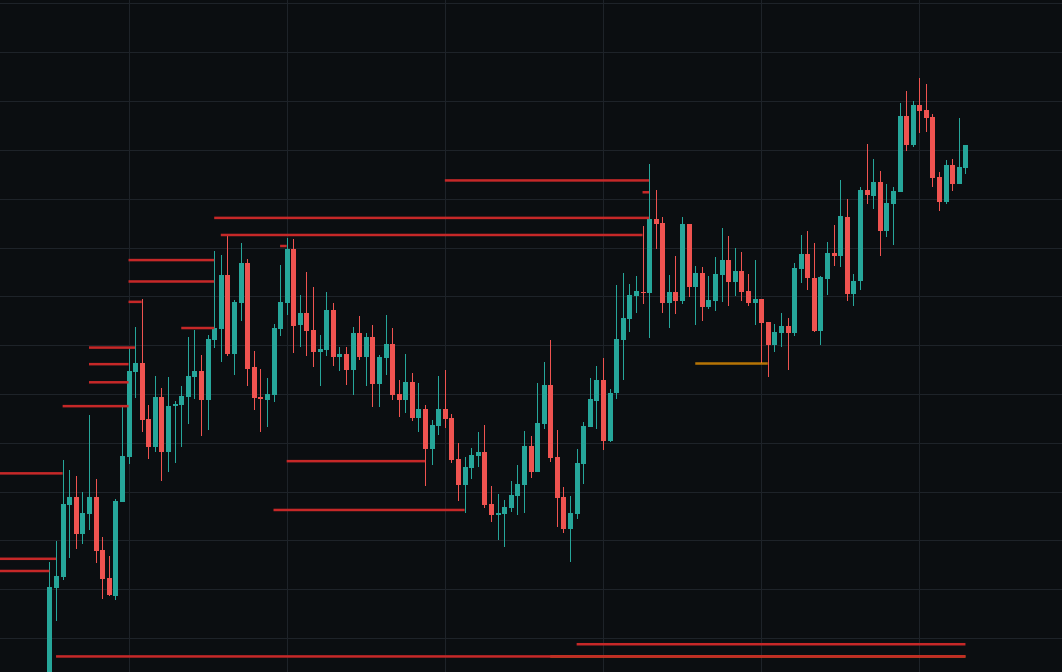
Tracks and visualizes high-volume limit orders using distinct cyan horizontal levels on the chart. To help traders differentiate market states, when the price pierces a level but the underlying order continues to stand, the cyan line fades in intensity. This allows you to quickly separate untouched supply/demand blocks from heavily tested and partially absorbed order walls.
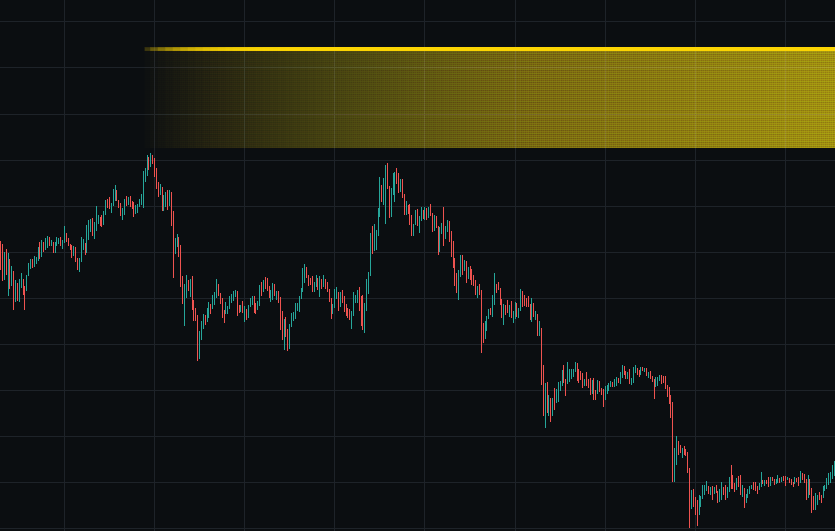
Detects and visualizes deceptive order book activity directly on the chart using a yellow gradient block. The indicator tracks high-frequency placement and removal of massive limit orders designed to lure the market into a specific direction before a pivot occurs. Because this behavior requires deep liquidity, the indicator dynamically screens the market and only populates on assets with confirmed, active manipulation patterns.
Tracks the accumulation of market stop-orders and liquidation thresholds across derivatives exchanges. It plots these critical risk areas directly on the chart using red and yellow horizontal lines, flagging the largest, most critical liquidity pockets in yellow. Since asset prices are systematically driven toward major liquidation clusters to capture liquidity, traders can use this tool to anticipate hunting phases, trend extensions, and flush-outs.
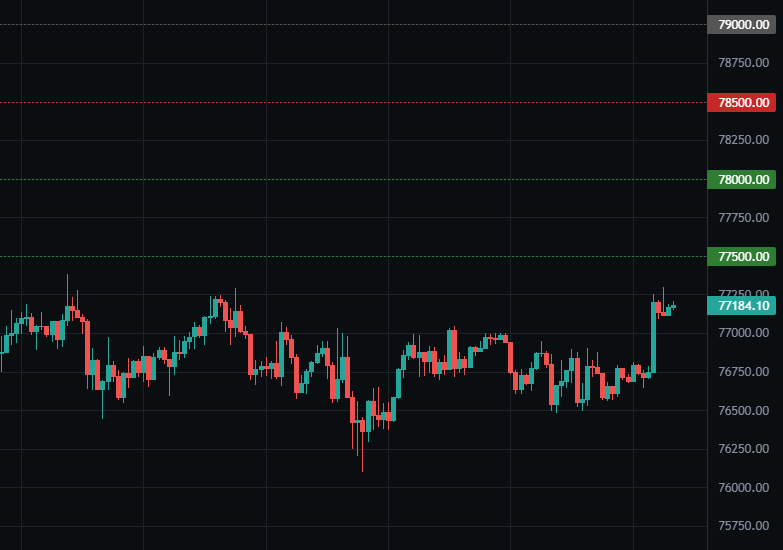
Decodes Deribit derivatives data to map out structural macro boundaries using color-coded dashed horizontal lines. It highlights defensive option support walls in green and heavy overhead resistance walls in red, centered around a gray Price Magnet line. This magnet visualizes the "Max Pain" theory, marking the price target where the largest cluster of options expire worthless to benefit market-maker positioning. Consequently, the market systematically gravitates toward the gray line as expiration approaches. Available exclusively for BTC.
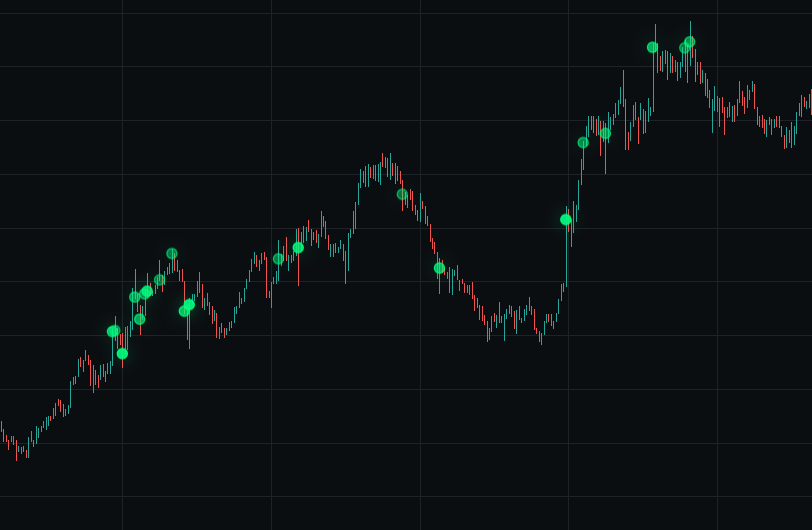
Filters out market noise by isolating high-volume market execution anomalies. The indicator plots green circular markers to pinpoint localized regions of heavy volume trades.
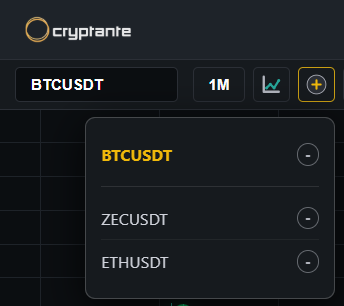
Provides efficient asset management for rapid chart switching. The menu features the active asset at the top with a "+" button for instant inclusion into your personal watchlist. Existing pairs can be systematically purged from the layout by tapping the corresponding "-" button, ensuring a clean and focused trading workspace.
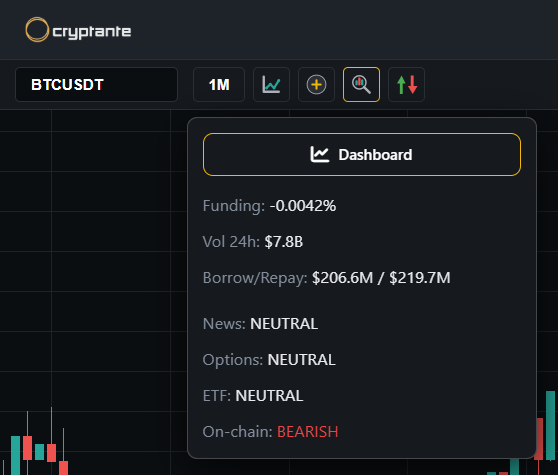
Delivers a snapshot of real-time market telemetry directly over your active chart. The dropdown aggregates individual token analytics (24h Trading Volume, Borrow/Repay ratios) with broader market sentiment tracking across options, ETFs, news flow, and on-chain ledger activity. Users can utilize the primary "Dashboard" action button to instantly navigate to the comprehensive, full-scale market intelligence portal.
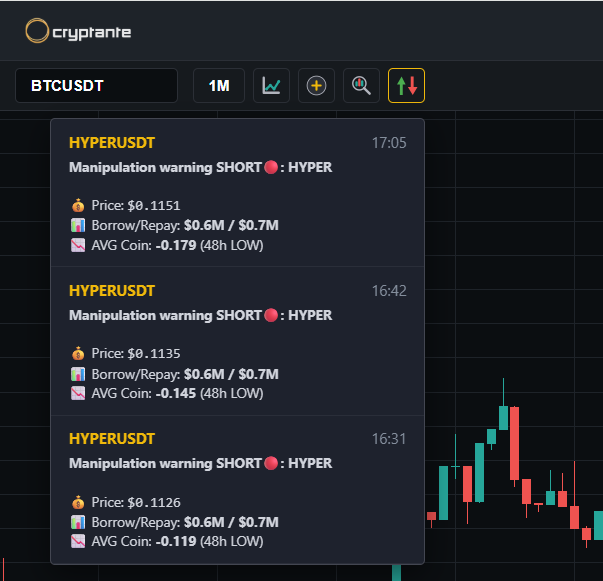
Displays real-time automated alerts for institutional manipulation and heavy directional market pressure. It acts as a visual radar for anomalous trading setups, featuring interactive notifications that immediately redirect you to the selected asset's chart upon being clicked.